
Hoopsalytics Tour
Explore all the amazing coaching tools and insights Hoopsalytics has to offer.
Interactive Shot Charts
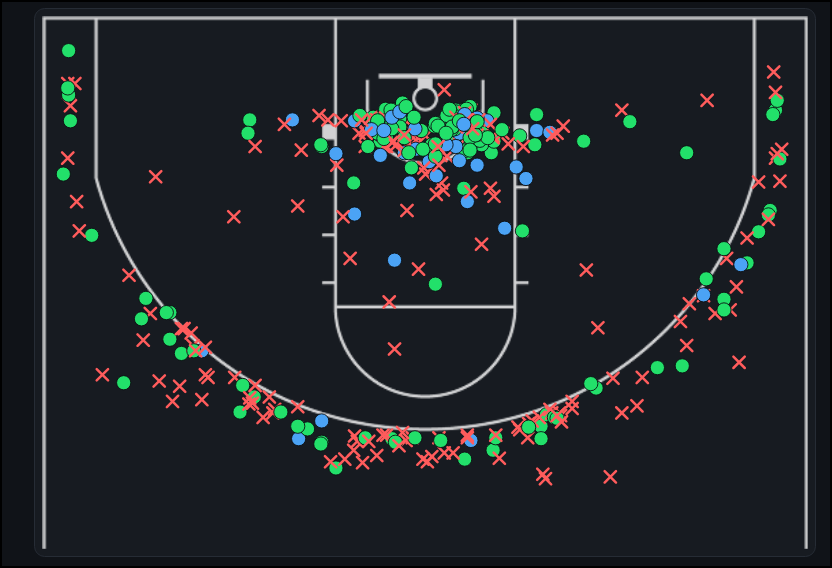
Not just a pretty picture, Hoopsalytics shot charts are a fully interactive, visual journey into where your shots come from, and how they can be successful.
Unlike the antiquated systems your competition may be still using, these shot charts show made, missed AND fouled attempts, let you filter by shot type, distance or any region of the court, and optionally show you where shots come from when running different offensive and defensive sets. There's no other system that gives you this level of detail.
Feature Summary
- See locations of every made shot, miss, and fouled attempt.
- Show shots by the entire team, opponents, or just specific players.
- Filter by shot distance (to see who is inefficient at midrange shots).
- Filter by shot type (i.e. runners, jumpers), and see player's percentages change.
- Select an area of the court, and see how shot success increases or decreases.
- See points-per-shot and percentages change according to how shots are selected.
- Show shots taken in various offensive or defensive sets.
- Show rebound locations from all selected shots.
- Play video clips from selected shots.